
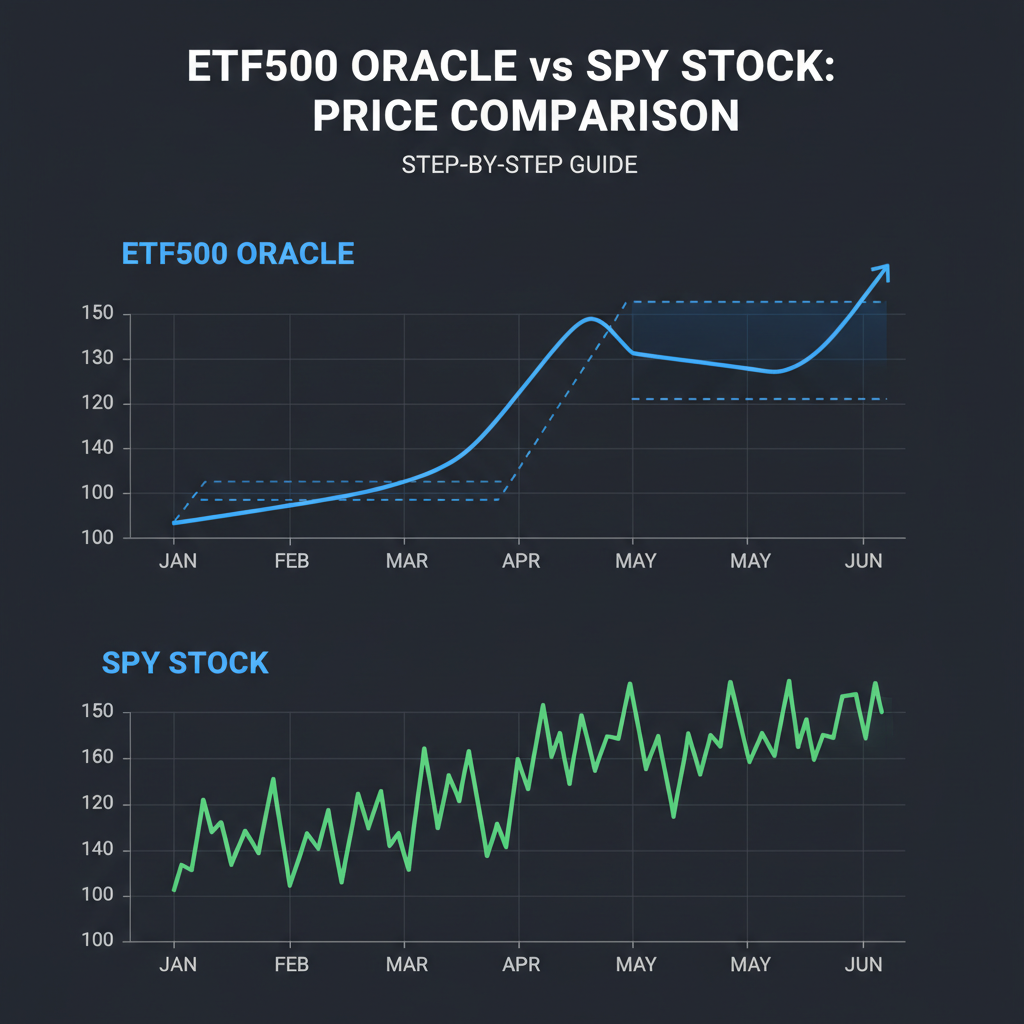
In the evolving landscape of decentralized finance, the tokenized S and P 500 on Solana stands out as a game-changer for investors seeking exposure to traditional markets without the constraints of legacy systems. Dubbed ETF500 in on-chain circles, this synthetic S and P 500 token enables seamless, 24/7 trading directly on Solana's high-speed blockchain. As of January 31,2026, the underlying State Street SPDR S and P 500 ETF Trust (SPY) trades at $691.97, reflecting a modest 24-hour dip of $2.49 amid broader market stability.
Solana's dominance in tokenized equities is undeniable, capturing over 95% of trading volume in late 2025 through platforms like xStocks. This surge aligns with institutional momentum, as WisdomTree expands tokenized funds to Solana, allowing self-custody wallets to mint and manage assets on-chain. Yet, beneath the hype lies a risk-aware reality: Solana's price struggles against the $145-$147 resistance, even as DEX volumes hit records.
ETF500's Explosive Growth and Market Integration
xStocks spearheaded the tokenized S and P 500 on Solana in mid-2025, delivering nearly $500 million in cumulative on-chain volume within six weeks. Each ETF500 token mirrors SPY at a 1: 1 backing ratio, secured by real shares in regulated custodians. This setup unlocks fractional ownership for retail traders and composability for DeFi strategies, such as yield farming paired with S and P exposure. Non-U. S. investors, in particular, gain frictionless access to U. S. equities, bypassing time zone limitations and capital controls.
Ondo Finance's impending launch of tokenized U. S. stocks and ETFs in early 2026 will amplify this trend, potentially pushing ETF500 liquidity past $1 billion. S and amp;P Global highlights tokenization's promise: 24/7 liquidity, instant settlement, and automation. However, Solana ETFs logging 15 straight days of inflows to $888 million raise questions about centralization risks. Large non-staking ETF pools could drain validator yields, fragmenting the network's security model.

From a risk perspective, ETF500 traders must weigh Solana's on-chain strength against its price cap. Institutional inflows bolster revenue, but weak broader activity signals potential volatility. My view: this creates asymmetric opportunity for hedged positions, blending tokenized equities with Solana-native derivatives.
Mechanics of Synthetic S and P 500 Tokens on Solana
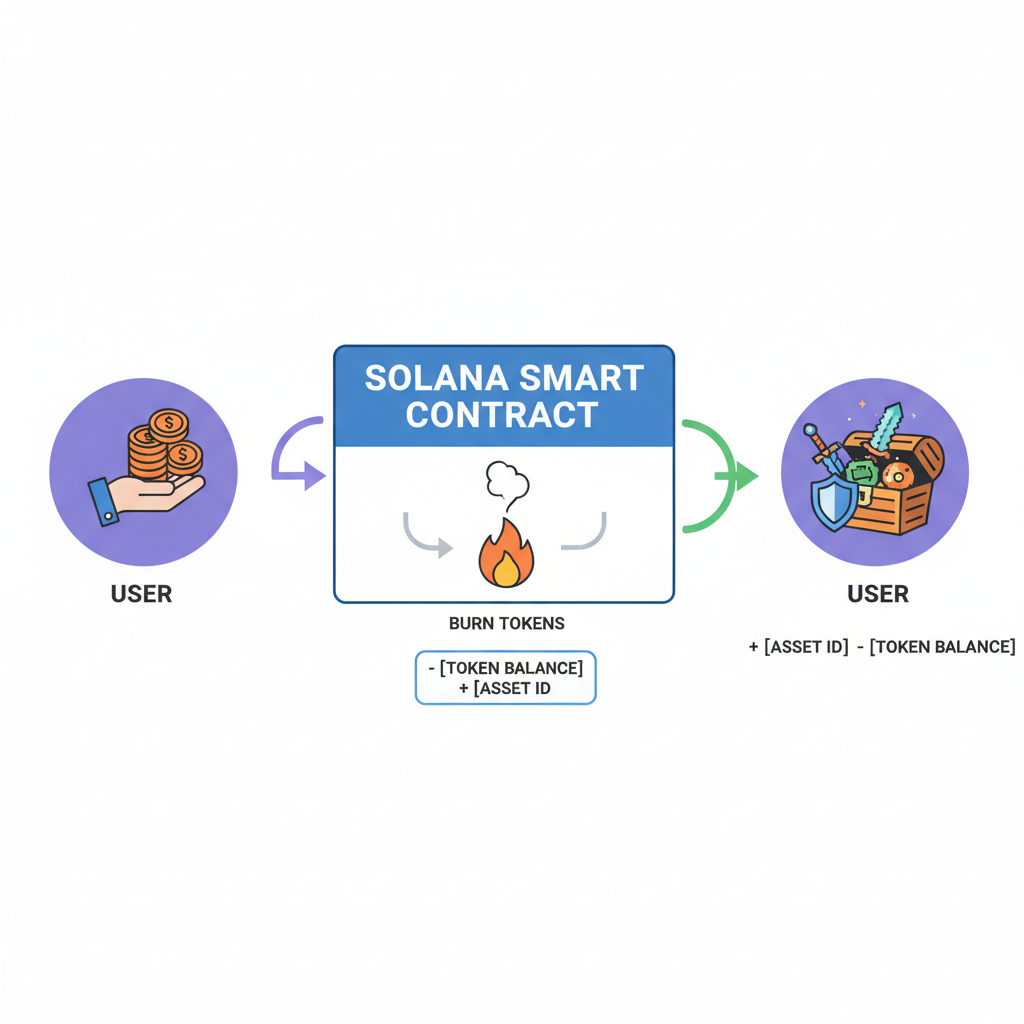
At its core, ETF500 functions as a synthetic asset, pegged to SPY's $691.97 spot price through oracle feeds and collateralized minting. Platforms like xStocks issue tokens via smart contracts, where users deposit stablecoins or SOL to mint ETF500, redeemable for underlying shares off-chain if needed. Solana's sub-second finality ensures trades settle instantly, contrasting SPY's T and 1 cycle.
Key to this is 1: 1 backing: every tokenized share corresponds to a custodied SPY unit, audited regularly for transparency. This mitigates counterparty risk compared to uncollateralized perps on other chains. Still, oracle failures or custodian lapses pose tail risks, amplified by Solana's occasional outage history. Prudent traders layer on-chain hedges, like shorting SOL perps if ETF500 premiums spike.
Navigating On-Chain ETF Trading Risks and Strategies
While ETF500 on-chain trading offers unparalleled access, risks abound. Regulatory scrutiny intensifies as tokenized funds like WisdomTree's integrate TradFi, potentially inviting SEC clamps on non-U. S. offerings. Solana's validator economy faces dilution from ETF capital that skips staking, per CryptoSlate analysis, eroding network yields over time.
Strategically, I advocate risk-adjusted plays: pair ETF500 longs with SOL puts to hedge blockchain-specific drawdowns. At SPY's current $691.97, a 5-10% allocation suits aggressive portfolios, scaled by volatility regimes. Monitor resistance levels; Solana's failure to break $147 could cascade to tokenized volumes.
Impermanent loss in liquidity provision adds another layer, particularly when pairing ETF500 with volatile assets like SOL. My recommendation: limit LP exposure to 20% of position size, favoring directional trades during low-volatility windows around SPY's $691.97 anchor.
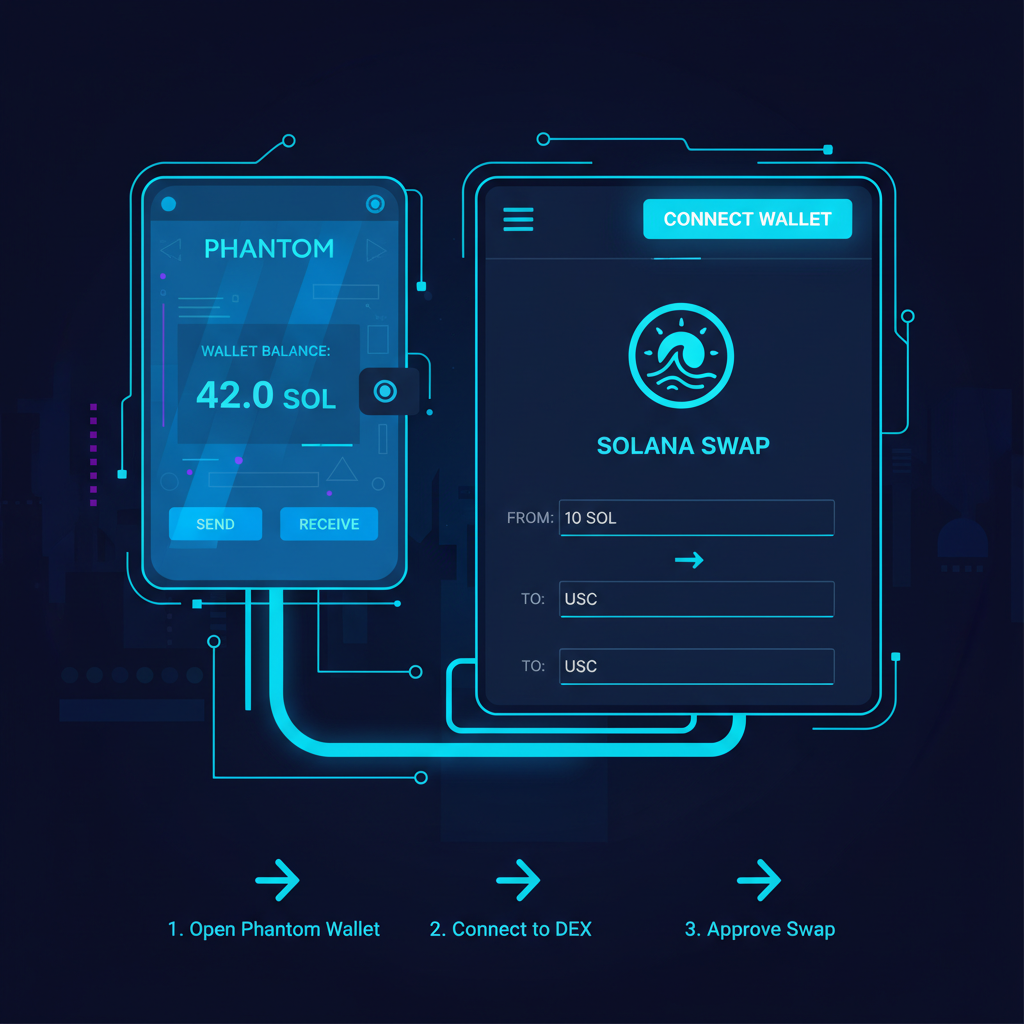
Step-by-Step ETF500 Trading on Solana DEXes
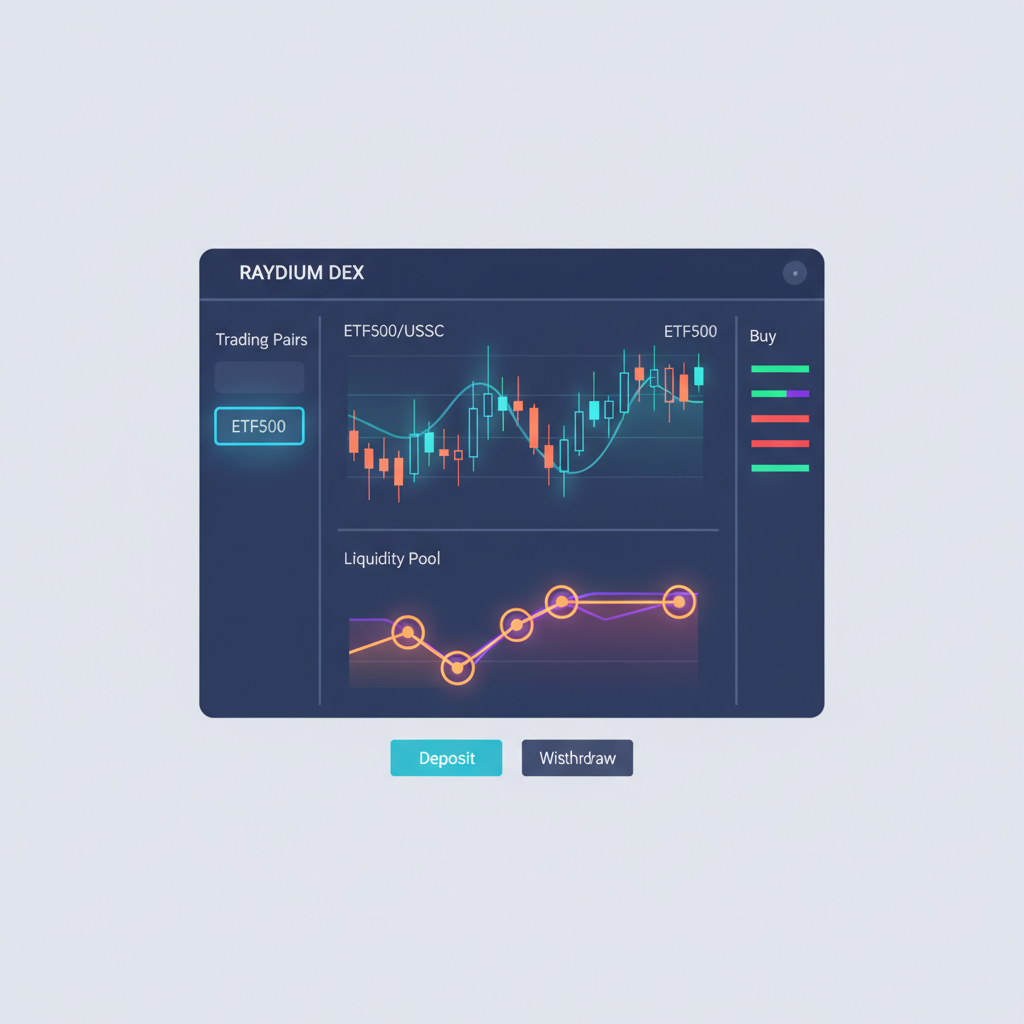
Mastering on-chain ETF trading starts with the right tools and mindset. Solana's ecosystem, powered by Jupiter aggregators and Raydium pools, simplifies entry for tokenized S and amp;P 500 Solana exposure. Here's how seasoned traders execute with precision.
Master ETF500: Buy, Sell & Monitor Tokenized S&P 500 on Solana
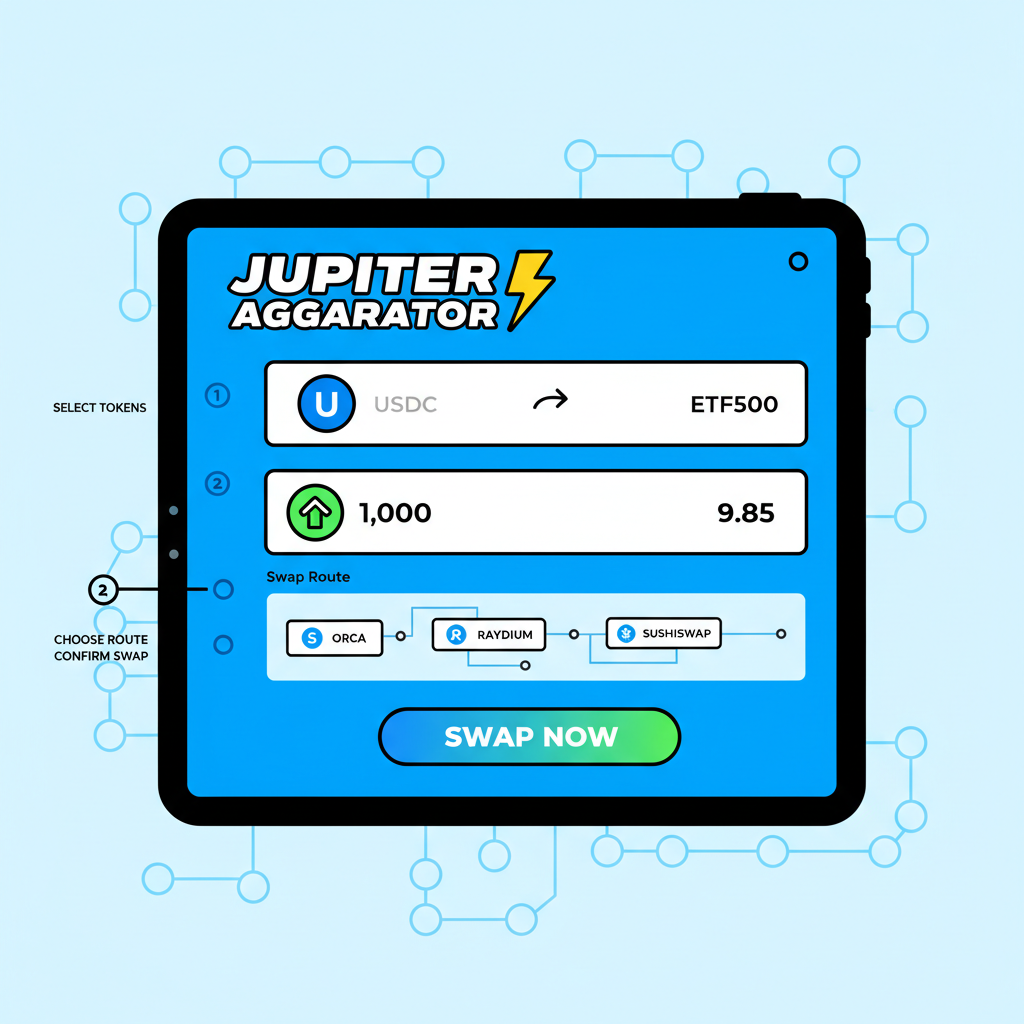
Beyond basics, integrate ETF500 into composable strategies. Collateralize positions in lending protocols like Marginfi for leveraged longs, or use perpetuals on Drift for delta-neutral hedges. This synthetic S and amp;P 500 token shines in portfolio construction, offering beta exposure without off-chain friction.
Yet, precision demands vigilance. Oracle divergences, though rare on Solana's Pyth feeds, can unpeg ETF500 briefly from SPY's $691.97. Historical data shows premiums rarely exceed 0.5%, but flash crashes amplify slippage. Risk-aware traders set tight stop-losses at 2% drawdowns, dynamically adjusted via on-chain bots.
Hedging Strategies for ETF500 Volatility
In my decade analyzing derivatives, tokenized equities like ETF500 demand hybrid hedges blending TradFi and DeFi. Start with options overlays: long ETF500 calls paired with SOL put spreads mitigate chain risks without eroding upside. At current levels, a SPY-equivalent strangle targets 10-15% annualized returns, risk-adjusted for Solana's 40% implied vol.
Consider correlation dynamics. ETF500 tracks SPY tightly, but Solana's price cap at $145-$147 injects beta slippage. Data from late 2025 shows tokenized volumes decoupling during network congestion, underscoring the need for diversified collateral. Platforms like xStocks mitigate this via multi-custodian redundancy, yet black swan events linger.
Solana Technical Analysis Chart
Analysis by Market Analyst | Symbol: BINANCE:SOLUSDT | Interval: 1D | Drawings: 7
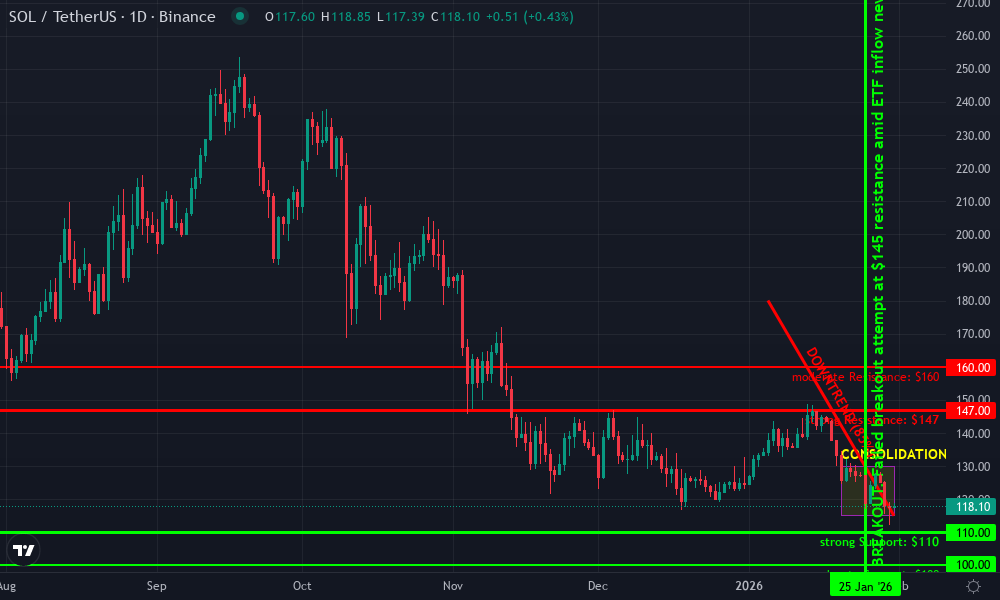
Technical Analysis Summary
In my balanced technical style, start by drawing a primary downtrend line connecting the swing high around $180 on January 5, 2026, to the recent low near $115 as of January 31, 2026, highlighting the dominant bearish channel. Add horizontal lines at key support $110 (strong recent lows) and $100 (psychological round number), and resistance at $145-$147 (major overhead from recent failures) and $160 (prior swing). Use a rectangle to box the recent consolidation zone from January 20-31 between $115-$130. Place fib retracement from the major high ~$260 in early December 2025 (noted but focus 2026) to current low for potential pullback levels. Mark callouts on declining volume during the drop and MACD bearish crossover mid-January. Add arrows down at failed resistance test and up at support bounce potential. Vertical line at January 25 for failed breakout event.
Risk Assessment: medium
Analysis: Bearish trend intact but support test + bullish fundamentals create balanced setup; medium tolerance suits waiting for confirmation
Market Analyst's Recommendation: Hold off new longs until close above $145 or strong volume reversal at $110; medium risk scalps possible
Key Support & Resistance Levels
📈 Support Levels:
- $110 - Recent swing low with volume cluster strong
- $100 - Psychological support aligning with fib 0.618 moderate
📉 Resistance Levels:
- $147 - Key resistance zone from news context, multiple rejections strong
- $160 - Intermediate swing high moderate
Trading Zones (medium risk tolerance)
🎯 Entry Zones:
- $115 - Bounce from strong support with potential volume divergence medium risk
🚪 Exit Zones:
- $147 - Test of key resistance for profit taking 💰 profit target
- $105 - Invalidation below major support 🛡️ stop loss
Technical Indicators Analysis
📊 Volume Analysis:
Pattern: Declining volume on downside, potential exhaustion
Volume drying up near lows suggests weakening sellers
📈 MACD Analysis:
Signal: Bearish crossover with histogram contraction
MACD line below signal, but momentum fading
Applied TradingView Drawing Utilities
This chart analysis utilizes the following professional drawing tools:
Disclaimer: This technical analysis by Market Analyst is for educational purposes only and should not be considered as financial advice. Trading involves risk, and you should always do your own research before making investment decisions. Past performance does not guarantee future results. The analysis reflects the author's personal methodology and risk tolerance (medium).
Ondo Finance's early 2026 rollout promises deeper liquidity, potentially halving spreads and boosting ETF500 on-chain trading volumes. Paired with WisdomTree's institutional push, Solana tokenized equities could claim 20% of global synthetic stock flows by year-end. But centralization whispers persist: ETF inflows to $888 million strain non-staking capital, per ongoing validator debates.
For aggressive allocators, allocate 7% to ETF500 longs, vested over 30 days to average into dips. Conservative profiles? Collar with 3-month SOL futures, capping downside at 5% while preserving SPY's $691.97-driven gains. This balances opportunity against Solana's resistance hurdles.
Future Outlook for Solana Tokenized Equities
Looking to 2026, ETF500 guide 2026 projections hinge on regulatory tailwinds. As BlackRock echoes tokenization on public chains like Solana, expect ETF approvals accelerating synthetic S and amp;P 500 token adoption. xStocks' $500 million milestone foreshadows $5 billion AUM, fueled by 24/7 composability absent in traditional markets.
Risks evolve too. Heightened SEC focus on tokenized funds could impose KYC gates, curbing retail frenzy. Validator yield dilution from ETFs poses long-term threats, potentially hiking MEV reliance. My stance: these headwinds forge resilient protocols, rewarding early hedgers.
Ultimately, ETF500 embodies DeFi's maturation, fusing S and amp;P 500 stability with blockchain velocity. Traders who master these dynamics unlock superior risk-adjusted returns, navigating volatility with calculated edge.


No comments yet. Be the first to share your thoughts!