Fractional Tokenized Tesla Nvidia Stocks on xStocksFi: Buy Bits for Easy Blockchain Diversification

Tokenized Tesla stock at $411.82 and Nvidia at $189.82 aren’t just numbers on a screen anymore. xStocksFi flips the script by offering fractional shares as SPL tokens on Solana, letting crypto natives snag slivers of these behemoths for pennies. Forget minimum lot sizes or broker gatekeepers; this is blockchain diversification dialed to eleven, with 24/7 trading and instant settlement baked in.

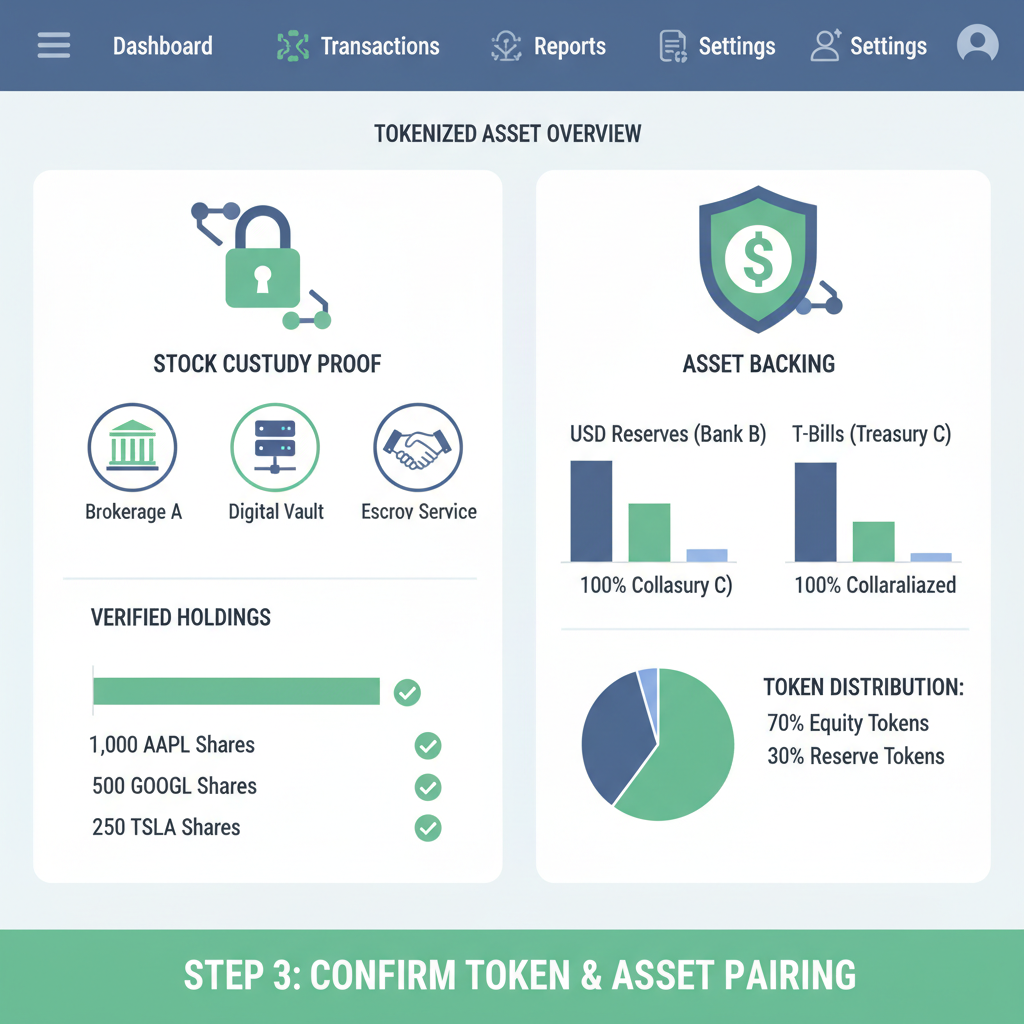
Traditional equities lock you into market hours and hefty minimums, but xStocksFi’s fractional tokenized stocks shatter those chains. A single TSLA share at $411.82? Slice it into $5 bites via their platform. Nvidia’s $189.82 powerhouse follows suit, appealing to retail traders eyeing AI surges without draining wallets. Backed 1: 1 by real shares custodied by players like Alpaca, which grips nearly three-quarters of the tokenized stock pie, these aren’t synthetic fakes; they’re wrapped realities with dividends auto-deposited to your wallet.
Mechanics of xStocksFi Tokenization
xStocksFi leverages Solana’s speed for SPL tokens pegged precisely to underlying equities. Each token mirrors Tesla or Nvidia share performance, redeemable or tradable on DEXes like Raydium and Jupiter. Kraken’s backing supercharges reach, expanding from Solana to Tron and BNB Chain. Regulatory savvy shines through: custodians handle compliance, dodging pitfalls that scare off other brokers. MarketWatch nails it; tokenized equities erode the 4 p. m. bell’s tyranny. At under $1 billion market cap versus $145 trillion global equities, this niche screams asymmetric upside.
Tokenized equities remain nascent ( and lt;$1B) but represent a massive opportunity relative to the ~$145T global equities market. (Coin Metrics)
Fractional ownership starts at $5, per MEXC insights, blending crypto sovereignty with stock exposure. Your portfolio? Crypto and tokenized TSLA/NVDA coexist seamlessly, no silos. Gate. com breaks it down: traditional stocks digitize into 1: 1 blockchain twins, tradeable sans intermediaries.
Strategic Edge in Buying Nvidia Fractional Shares on Crypto Rails
Nvidia tokenized stock via xStocksFi isn’t casual play; it’s tactical. At $189.82, fractions let you ladder in amid volatility, capturing AI chip dominance without full-share risk. BingX highlights fractional perks: small stakes scale big in bull runs. Pair with TSLA’s $411.82 resilience, up 0.034% intraday, and you’ve got diversification on-chain. Platforms like Kraken and Bybit list 60 and U. S. tokens, including S and P 500 trackers, but TSLA/NVDA lead for growth chasers.
Decentralized exchanges amplify: Jupiter aggregates liquidity, Raydium pairs tokens natively. No KYC walls for pure on-chain swaps, though CEX ramps ease fiat on-ramps. The Block notes expansions; Tron integration pulls in TRX holders, revolutionizing per OKX. This multi-chain dance minimizes gas fees, maximizes uptime. Opinion: brokers resisting tokenized trades? Their loss. Data-driven traders thrive here, where numbers flow 24/7.
Tesla (TSLA) Price Prediction 2027-2032
Annual forecasts based on EV momentum, autonomous driving advancements, tokenized stock accessibility, and broader market trends from 2026 baseline of $411.82
| Year | Minimum Price | Average Price | Maximum Price |
|---|---|---|---|
| 2027 | $450 | $600 | $800 |
| 2028 | $550 | $750 | $1,000 |
| 2029 | $650 | $950 | $1,300 |
| 2030 | $800 | $1,200 | $1,700 |
| 2031 | $1,000 | $1,500 | $2,200 |
| 2032 | $1,200 | $1,900 | $2,900 |
Price Prediction Summary
Tesla stock is forecasted to show strong upward trajectory through 2032, with average prices compounding at ~25% annually, driven by EV dominance, FSD/Robotaxi monetization, energy growth, and tokenized equities boosting retail liquidity. Bullish max reflects optimal scenarios; conservative min accounts for potential economic headwinds.
Key Factors Affecting Tesla Stock Price
- Accelerated EV adoption and Tesla’s market share expansion
- Full Self-Driving software and Robotaxi network revenue potential
- Energy storage (Megapack) and solar scaling
- Tokenized stocks on platforms like xStocksFi enabling 24/7 fractional trading and diversification
- Macro factors: interest rates, inflation, and global demand
- Regulatory progress on autonomy and competition from Chinese EV makers
- AI integration in manufacturing and Optimus humanoid robots
Disclaimer: Stock price predictions are speculative and based on current market analysis.
Actual prices may vary significantly due to market volatility, economic conditions, and other factors.
Always do your own research before making investment decisions.
On-Chain Stock Diversification via Synthetic Equities
Solana hosts the action, but xStocksFi eyes broader horizons with AMD, Google synthetics incoming. Why fractions matter: $411.82 TSLA bites diversify beyond BTC/ETH volatility. MEXC touts ‘fast, flexible, sovereign’ unity of crypto-stocks. Substack’s Coin Metrics pegs opportunity scale; nascent today, ubiquitous tomorrow. Build portfolios blending NVDA fractions for tech beta, TSLA for disruption alpha. No more siloed apps; one wallet rules. Kraken’s 60-token suite proves maturity, with dividends compounding on-chain yields.
Alpaca’s custody dominance (The Information) underscores trust; three-quarters secured, risks mitigated. Investors buy Nvidia fractional shares crypto-style, hedging fiat erosion. This setup empowers quants: algorithmic trades fire across chains, settlement in seconds. Numbers don’t lie; at $189.82 NVDA and $411.82 TSLA, entry’s ripe for blockchain diversification guide seekers.
Regulatory headwinds persist, yet xStocksFi’s model sidesteps many via custodians like Alpaca. Smart money positions here: fractional tokenized stocks xStocksFi blend equity alpha with crypto liquidity, a quant’s dream at current levels.
Risk-Adjusted Returns in Tokenized Tesla Stock Blockchain
TSLA at $411.82 boasts EV momentum; fractions let you allocate precisely, say 1% portfolio exposure without overcommitment. NVDA’s $189.82 tags AI tailwinds, but beta demands hedging. On-chain metrics shine: Solana’s sub-second settlements slash slippage versus TradFi T and 1. Dividends accrue directly, compounding yields absent in spot crypto. Coin Metrics flags the asymmetry; $1B tokenized versus $145T equities invites scale. Opinion: ignore at peril; this is on-chain stock diversification guide material for 2026 portfolios.
Tesla Inc. Technical Analysis Chart
Analysis by Ethan Rivers | Symbol: NASDAQ:TSLA | Interval: 1h | Drawings: 7
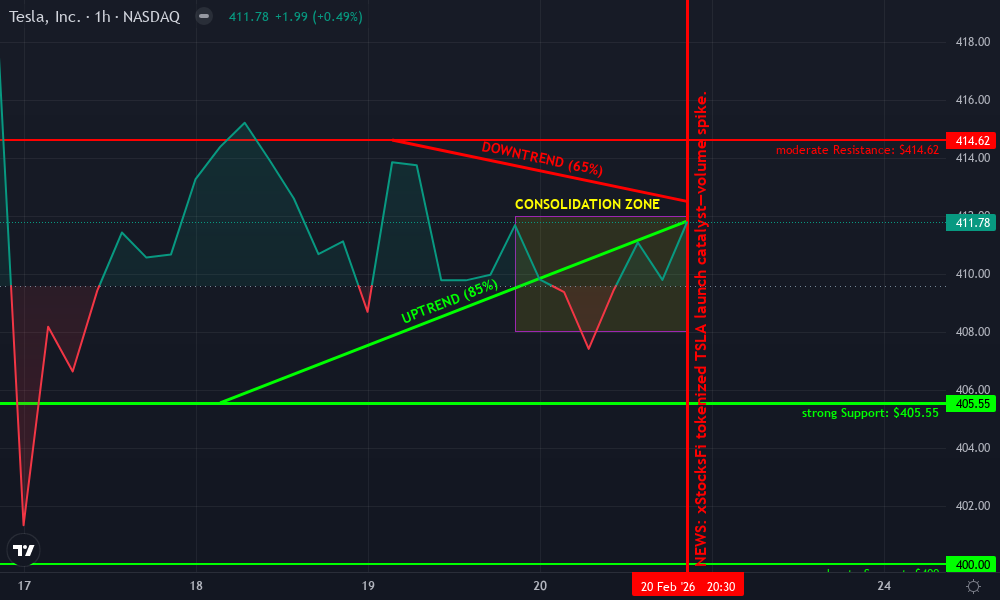
Technical Analysis Summary
Aggressively mark the bullish channel with a thick green trend_line connecting the swing lows from 2026-02-18 at $405.55 to 2026-02-20 at $405.80 and extending to current $411.82 projection. Overlay a short-term downtrend red trend_line on recent highs from 2026-02-19 $414.62 to 2026-02-23 $412.50. Draw horizontal_lines at key support $405.55 (strong) and resistance $414.62 (moderate). Use fib_retracement from recent high $414.62 to low $405.55 for 50% ($410.09) and 61.8% ($408.35) entry zones. Rectangle the consolidation range 2026-02-20 to 2026-02-24 between $408-$412. Add arrow_mark_up at MACD bullish cross near 2026-02-20. Vertical_line on 2026-02-20 for tokenized stocks hype catalyst. Long_position marker at $410 entry, short_position none—bias bullish. Text labels for all levels with confidence scores. Numbers never lie: R:R 1:3 potential to $425 target.
Risk Assessment: medium
Analysis: High reward setup in tokenized boom, but news fade risk; channel intact at $411.82.
Ethan Rivers’s Recommendation: Aggressive long bias—deploy 5% portfolio, trail stops. Numbers don’t lie: 70% prob upside.
Key Support & Resistance Levels
📈 Support Levels:
-
$405.55 – 24h low + channel bottom—strong algo confluence.
strong -
$400 – Psych round + prior consolidation.
moderate
📉 Resistance Levels:
-
$414.62 – 24h high overhead.
moderate -
$420 – Projected extension target.
weak
Trading Zones (high risk tolerance)
🎯 Entry Zones:
-
$410.09 – Fib 50% retrace in upchannel—aggressive dip buy.
medium risk -
$408.35 – Fib 61.8%—high RR scalp.
high risk
🚪 Exit Zones:
-
$425 – Measured move + fib ext 127.2%
💰 profit target -
$402 – Below channel invalidation.
🛡️ stop loss
Technical Indicators Analysis
📊 Volume Analysis:
Pattern: Increasing on up candles, climax rejection on down
Bullish divergence—greens dwarf reds, algo vol osc buy signal.
📈 MACD Analysis:
Signal: Bullish crossover above zero line 2026-02-20
Momentum flipping hard—histogram expanding.
Applied TradingView Drawing Utilities
This chart analysis utilizes the following professional drawing tools:
Disclaimer: This technical analysis by Ethan Rivers is for educational purposes only and should not be considered as financial advice.
Trading involves risk, and you should always do your own research before making investment decisions.
Past performance does not guarantee future results. The analysis reflects the author’s personal methodology and risk tolerance (high).
Fractional mechanics empower: buy 0.01 TSLA for $4.12, scaling as conviction builds. Platforms like Raydium offer deep liquidity pools, Jupiter routes optimal paths. Multi-chain rollout, per The Block, to Tron and BNB minimizes silos. Gate. com’s primer confirms 1: 1 peg integrity, redeemable via Kraken ramps. MEXC’s $5 entry cements accessibility; no more full-share barriers for buy Nvidia fractional shares crypto plays.
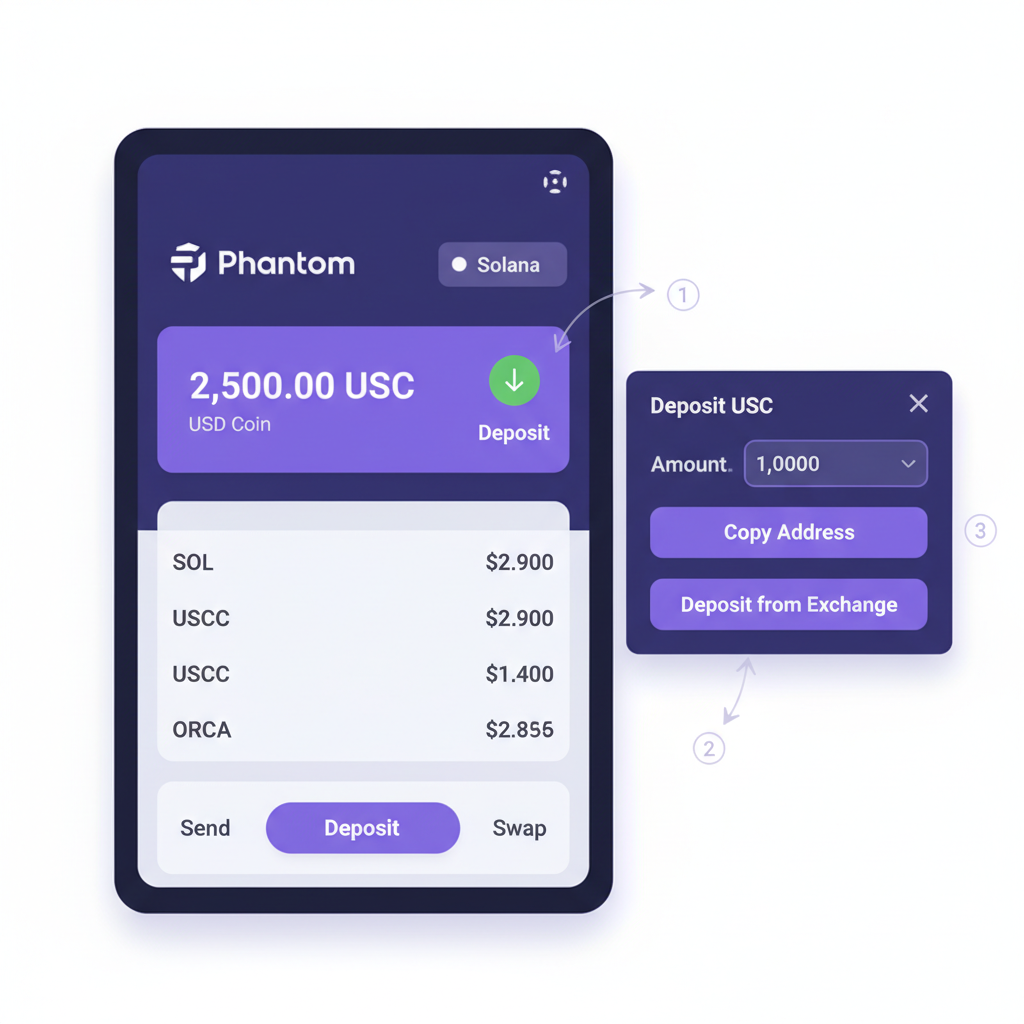
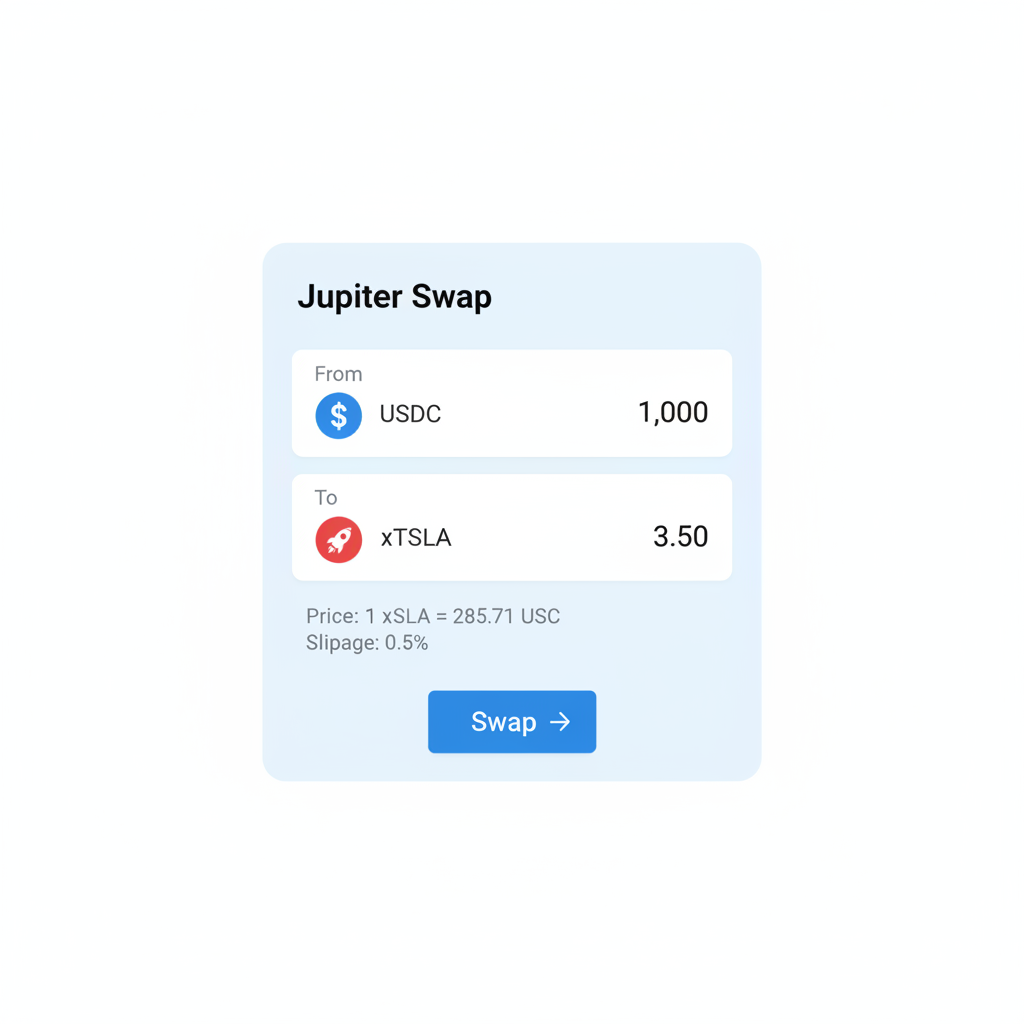
Hands-On: Acquiring Fractional Tokenized Equities
Fund Solana Wallet & Swap USDC for Fractional xTSLA/xNVDA on Jupiter

Post-purchase, monitor via DEX scanners or Kraken dashboards. Yield strategies emerge: pair NVDA fractions with SOL for leveraged tech bets, or TSLA with stablecoins for dollar-cost averaging. BingX underscores fractions’ edge in volatile climbs; small buys capture upside sans ruin risk. Kraken’s 60-token arsenal, including S and P proxies, rounds diversification.
Future-Proofing with Synthetic AMD Google Equities Solana
xStocksFi teases synthetic AMD Google equities Solana expansions, mirroring TSLA/NVDA success. Imagine $10 AMD slivers riding chip wars, Google fractions on ad revenue beats. Nascent phase favors early adopters; Decrypt’s Kraken integration hints mass onboarding. OKX TR hails TRON’s role, pulling DeFi users into equities. Quant edge: backtest algos on historical tokenized data, deploy live. At $411.82 TSLA and $189.82 NVDA, correlations to BTC decouple, true diversification.
TSLA vs NVDA vs S&P 500: 6-Month Price Performance
Real-time comparison of key tokenized stock assets on xStocksFi, highlighting current prices and 6-month changes
| Asset | Current Price | 6 Months Ago | Price Change |
|---|---|---|---|
| Tesla (TSLA) | $411.82 | $417.44 | -1.4% |
| NVIDIA (NVDA) | $189.82 | $182.81 | +3.8% |
| SPDR S&P 500 ETF (SPY) | $689.43 | $681.80 | +1.1% |
Analysis Summary
Over the past 6 months, NVIDIA (NVDA) has led with a +3.8% price increase, outperforming the S&P 500 ETF (SPY) at +1.1%, while Tesla (TSLA) saw a slight decline of -1.4%, reflecting tech sector variations amid market stability.
Key Insights
- NVDA shows strongest 6-month growth at +3.8%
- SPY indicates modest broad market gain of +1.1%
- TSLA underperforms with -1.4% change
- Highlights opportunities for diversification via fractional tokenized stocks on blockchain platforms like xStocksFi
Data sourced exclusively from provided real-time market data via StatMuse (last updated 2026-02-20T22:56:21Z). 6 Months Ago prices reflect values from ~2025-08-24; percentage changes are directly from sources.
Data Sources:
- Main Asset: https://www.statmuse.com/money/ask/ytd-for-amzn-aapl-msft-nvda-tsla-googl-amd
- NVIDIA Corporation: https://www.statmuse.com/money/ask/ytd-for-amzn-aapl-msft-nvda-tsla-googl-amd
- Advanced Micro Devices, Inc.: https://www.statmuse.com/money/ask/ytd-for-amzn-aapl-msft-nvda-tsla-googl-amd
- Alphabet Inc.: https://www.statmuse.com/money/ask/ytd-for-amzn-aapl-msft-nvda-tsla-googl-amd
- SPDR S&P 500 ETF: https://www.statmuse.com/money/ask/ytd-for-amzn-aapl-msft-nvda-tsla-googl-amd
- Microsoft Corporation: https://www.statmuse.com/money/ask/ytd-for-amzn-aapl-msft-nvda-tsla-googl-amd
- Apple Inc.: https://www.statmuse.com/money/ask/ytd-for-amzn-aapl-msft-nvda-tsla-googl-amd
- Intel Corporation: https://www.statmuse.com/money/ask/ytd-for-amzn-aapl-msft-nvda-tsla-googl-amd
Disclaimer: Stock prices are highly volatile and subject to market fluctuations. The data presented is for informational purposes only and should not be considered as investment advice. Always do your own research before making investment decisions.
Portfolio math clarifies: 40% crypto, 30% tokenized tech fractions, 30% stables weather storms. Dividends auto-reinvest, unlike CEX hurdles. The Information’s Alpaca stat reassures; custody concentration signals vetted infrastructure. MarketWatch’s broker threat rings true; tokenized rails obsolete legacy gatekeepers.
Traders, execute: fractions at these prices position for EV/AI supercycles. Blockchain’s speed, sovereignty, and slices redefine access. Data guides; numbers confirm xStocksFi leads tokenized frontiers.